
By how much did local area population estimates change with rebasing?
AUSTRALIAN DEMOGRAPHY
The ABS recently released preliminary rebased Estimated Resident Populations (ERPs) for sub-state areas (like local government areas and SA2 areas) in its Regional Population publication. These are population totals; sub-state ERPs with age and sex detail will be published later in the year. The ERPs for 30th June 2021 in this release take into account the results of the 2021 Census, and differ from the 2021 ERPs released earlier in the year. These older ERPs were based on the 2016 Census and ‘rolled forward’ taking into account the births, deaths, internal migration, and overseas migration which occurred since then.
In a world of perfect demographic data, the rolled forward ERPs and the rebased ERPs would be very similar. But in reality, the demographic data needed to calculate ERPs varies in quality. Even the ERPs themselves remain estimates rather than exact counts, though ERPs based on census counts are generally regarded as good quality. We know that sub-state migration estimates are imperfect. There isn’t any direct measurement of emigration (people leaving the country) below the State/Territory scale. The ABS estimates it indirectly based on other data sources. We also don’t have annual direct measurements of internal migration within Australia. The ABS estimates it based on changes of address notified to Medicare, defence force data, and demographic modelling. In addition, births and deaths data are good quality, but not perfect. So the further out the rolled forward ERPs extend from a census, the more opportunity there is for them to accumulate errors. Revisions to ERPs are important because of their use in service delivery and planning, the allocation of funding to councils, and the use of ERPs as denominators for demographic rates and socio-economic indicators.
How different are the rebased ERPs for 2021 from the old rolled forward ERPs at the local government area scale? To measure the difference between the two sets of ERPs, I calculated the percentage discrepancy between them as:
(rolled forward ERP – rebased ERP) / rebased ERP × 100%.
A negative percentage indicates that the rolled forward ERP was lower than the rebased ERP; a positive percentage shows that the rolled forward ERP was too high. The graph below shows the distribution of discrepancies for 2021. 73% of LGAs had discrepancies within 5% (-5% to +5%). But that leaves 27% of LGAs with fairly large discrepancies (greater than +5% or more negative than -5%).
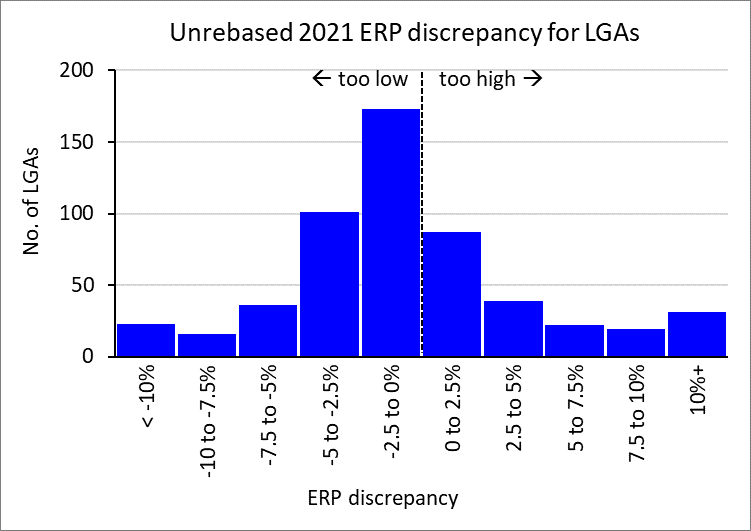

Most local government areas with large percentage discrepancies are ones with very small populations (often under 1,000 people). For example, Lockhart River had a rolled forward 2021 ERP of 817, but a rebased ERP of 653. Local government areas with the largest discrepancies in terms of absolute numbers are metropolitan councils with large populations. For example, the City of Melbourne had a rolled forward 2021 ERP of 169,860 but a rebased ERP of 153,674. For the City of Sydney, the equivalent figures are 242,237 (rolled forward) and 214,851 (rebased). In areas such as this, indicators making use of ERPs as denominators would have been particularly affected – for example, estimates of the proportion of the population vaccinated against Covid.
The main conclusion from this overview of ERP rebasing is that rolled forward ERPs at the local area scale should be regarded as estimates and approximate. If rolled forward ERPs are being used for decision-making, it might be useful to look at the discrepancy with the rebased ERP from the last couple of intercensal periods, and allow for that magnitude of difference; or at least the average amount of discrepancy across all councils. For the rebased 2021 ERPs the average absolute percentage discrepancy is 4.7%. ERPs for census years, rebased on that year’s census counts, are the most reliable. But even they are not perfect. And it is important to remember that the comparison here is with preliminary rebased ERPs. Final 2021 rebased sub-state ERPs will be published by the ABS next year.
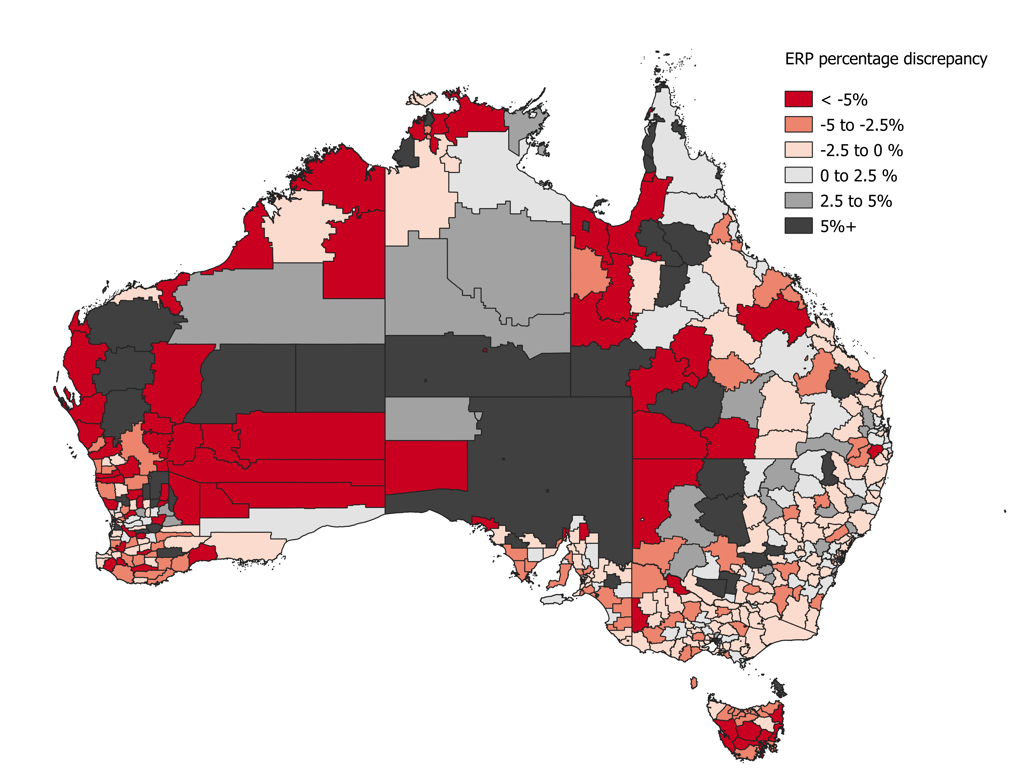
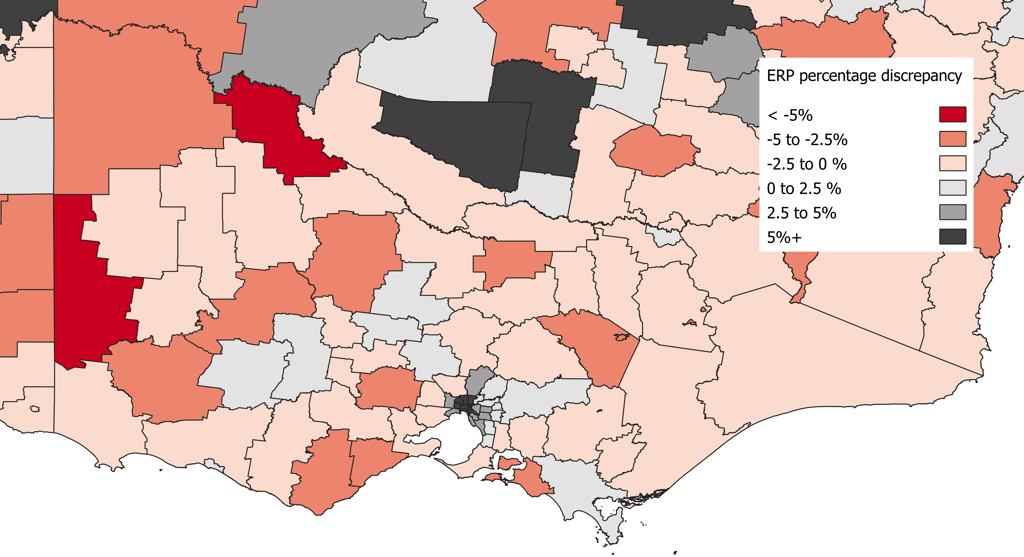
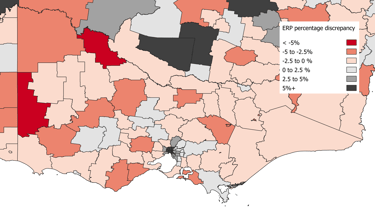
The map below indicates the percentage discrepancy between old rolled forward ERPs for local government areas and the new rebased ERPs. The red-orange shading indicates where the rolled forward ERPs were too low in 2021, while the grey shading shows where they were too high.
The overall picture across Australia looks fairly random. But if we zoom into Victoria, there is an interesting pattern of the rolled forward ERPs being too high in the central areas of Melbourne. This is probably due to the migration inputs to the ERP calculations not keeping up with the outward movement of population due to Covid (and it should be said that the estimation of population will have been especially difficult because of the Covid-related disruption to demographic trends and data sources). These are areas which had large temporary migrant populations, many of whom will have returned home during the pandemic. Similar over-estimation of the population occurred in central parts of Sydney.