
Why subnational population forecasts should be probabilistic
POPULATION FORECASTING
Tom Wilson
2/12/20263 min read
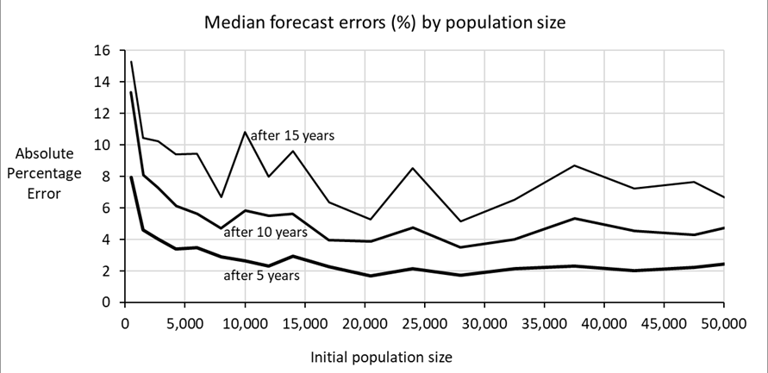
Subnational population forecasts, especially those for small areas, are susceptible to relatively large errors. Several studies have analysed the errors of past subnational forecasts and found that, as a general rule, errors are greater:
the further into the future the forecast extends,
the smaller the population,
for young childhood ages,
across the young adult ages where migration rates are highest, and
for migration than births and deaths.
The graph below depicts the average errors of subnational population forecasts and how they tend to vary by population size and number of years they extend into the future. The errors were calculated as part of an evaluation of several thousand forecasts of local area total populations in Australia produced over three decades. It shows that errors tend to increase with the number of years into the future, and that as population size declines below about 20,000 people, errors rise with decreasing population size.
The reasons that population forecasts turn out to have error include:
a limited understanding of the complexity of demographic processes,
errors in past data on births, deaths, migration, and the initial ‘jump off’ populations used in forecasts,
random noise in small population data,
approximations in demographic models,
the limited predictability of human behaviour (especially with decisions to have children or to migrate), and
the limited predictability of broader factors (e.g. national immigration policy, local planning regulations, housing market change, major local employer closure/opening, global recession, wars, pandemics).
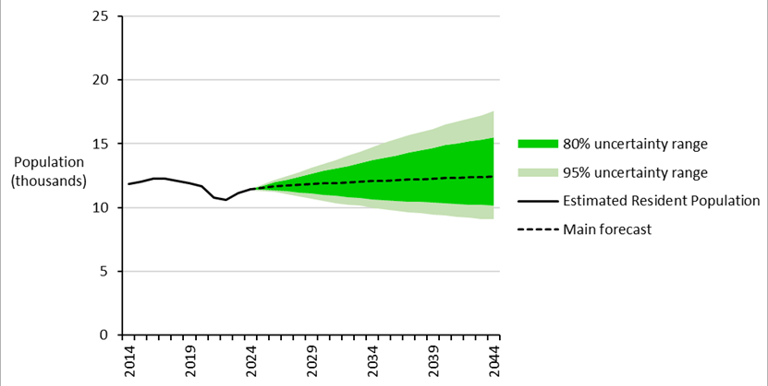
Subnational population forecasts have always suffered from error, and always will. Although future population cannot be forecast precisely, it is possible to generate a likely range of future populations. Probabilistic population forecasts, which consist of this range of future populations, provide numerical information about population uncertainty. They are often presented in graphs or tables showing forecast populations at the upper and lower bounds of specified uncertainty ranges. Users of the forecasts can then take account of uncertainty in their decision-making.
For example, the probabilistic forecast of a local area’s total population shown in the graph below includes
• a main forecast, as would be produced by a regular deterministic forecast,
• the 80% uncertainty range (the middle 80% of the distribution of possible population futures) marked in bright green, and
• the 95% uncertainty range (the middle 95%) shown in pale green.
This graph reveals that in the short-term the population of the example local area can be forecast quite accurately, but after more than just a few years ahead, there is increasing uncertainty.
Six reasons why subnational population forecasts should be probabilistic
1. It is impossible to create perfectly accurate population forecasts. There will always be error. This is especially the case at the local area scale.
2. Regular (deterministic) population forecasts can give the impression of a high degree of accuracy. Only one set of population numbers is presented for future years. There’s no indication of possible alternative population futures.
3. The difference between high and low variant projections is bad at indicating uncertainty. High and low variants are often based on arbitrary differences to projection assumptions (e.g. the total fertility rate is assumed to be 10% higher and lower). The high-low range tends to cover a different proportion of possible population futures over time (often a small proportion of the range in the short-term, and a larger proportion further in the long-term); and a different proportion of likely possible population futures between variables (e.g. between total population and the percentage aged 65 years and over). Net internal migration is difficult to specify in high and low variants because it must sum over all areas in a country to zero. If some areas have high net internal migration, then others must have low net internal migration.
4. It is now possible to produce subnational probabilistic population forecasts relatively easily. This was not the case until recently. Forecasting models are now available which can create forecasts for subnational populations which do not require large and impractical amounts of input data, preparation time, and resources. And they can be applied down to quite small population sizes.
5. Probabilistic forecasts give users numerical estimations of the possible range of future populations. These are based on statistical and demographic models which mimic the variability and uncertainty of demographic change in that area. The resulting probabilistic forecasts show which aspects of future population are relatively certain, and which aspects are less certain. This uncertainty can then inform decision-making, planning, and policy.
6. Probabilistic forecasts may encourage more flexible thinking in planning and investment decisions. Probabilistic forecasts will generally reveal high levels of uncertainty for SA2 areas and most local government areas. Planning decisions could be made which reflect the uncertain demographic future of a local area. For example, this may result in the design and construction of new building which has sufficient flexibility to allow different uses, such as a primary school, community centre, medical centre, or library.
More information about probabilistic population forecasts is available at https://drtomwilson.com/forecasts#faq.